Solana: On The Way To A New Peak? Technical Analysis As Of October 23, 2024
Solana continues its rise, validating a promising technical breakout. Let’s explore the upcoming prospects for the SOL price.

Situation of Solana (SOL)
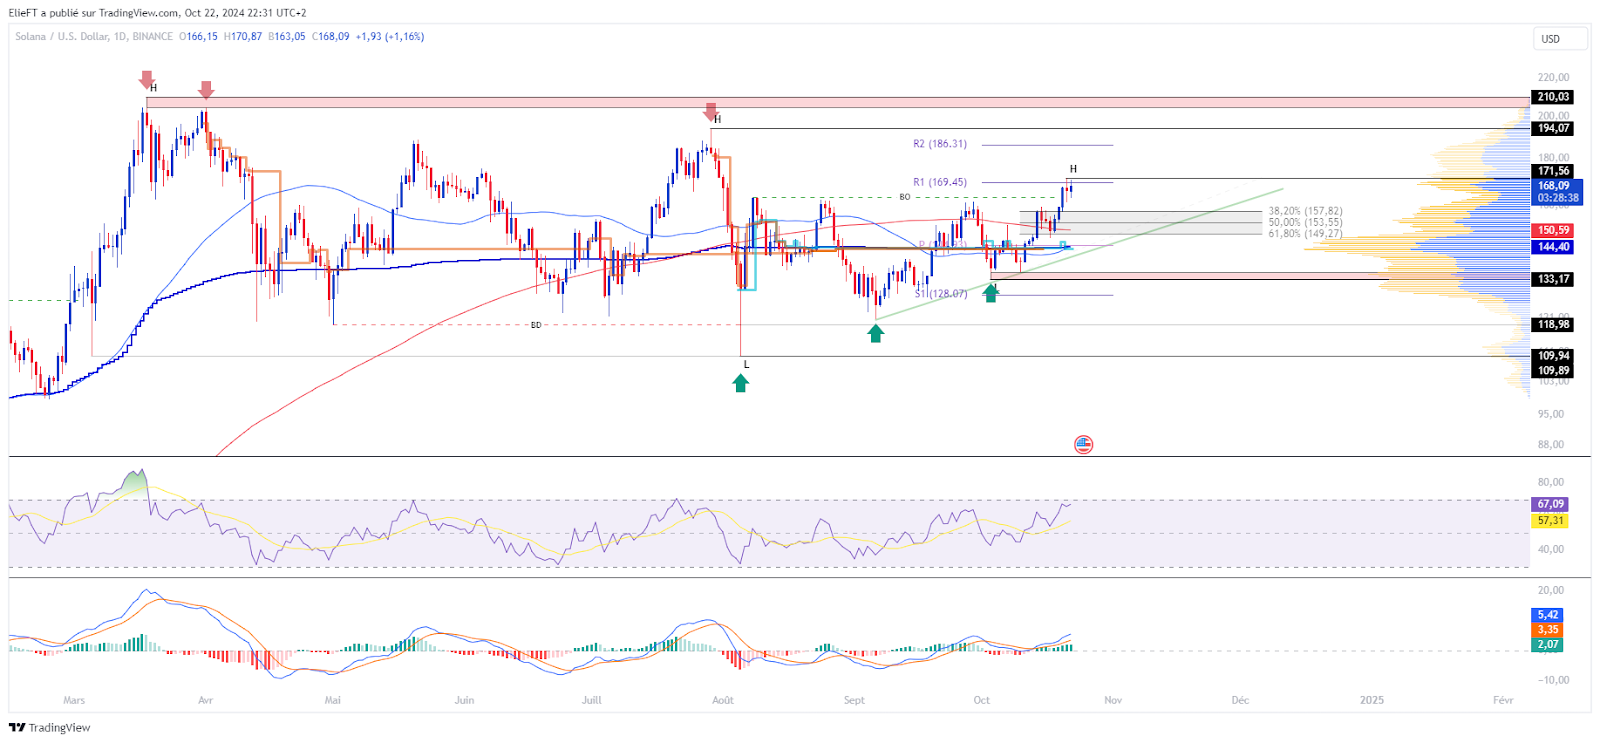
After bouncing off the support at $133, Solana managed to break through its daily resistance around $164. As specified in the analysis from October 16, this rise allowed the Solana price to position itself above its monthly pivot point, an important value zone, as well as its annual VWAP. From a chart perspective, the recent fluctuations in the Solana price today form an inverted head and shoulders pattern, which theoretically demonstrates a potential bullish reversal.
At the time these lines are written, the Solana price is trading around $170, a price level corresponding to the first resistance of the SOL monthly pivot points. The cryptocurrency thus validates a medium-term bullish trend. However, it will be necessary for the Solana price to continue its momentum to allow the daily moving averages to cross to the upside, which would further reinforce this idea. On the Solana momentum side, it clearly shows a recovery, as evidenced by both its price and its oscillators.
The current technical analysis has been conducted in collaboration with Elie FT, an investor and passionate trader in the cryptocurrency market. Today, he is a trainer at Family Trading, a community of thousands of active proprietary traders since 2017. You will find Live sessions, educational content, and support around financial markets in a professional and warm atmosphere.
Focus on Solana Derivatives (SOLUSDT)
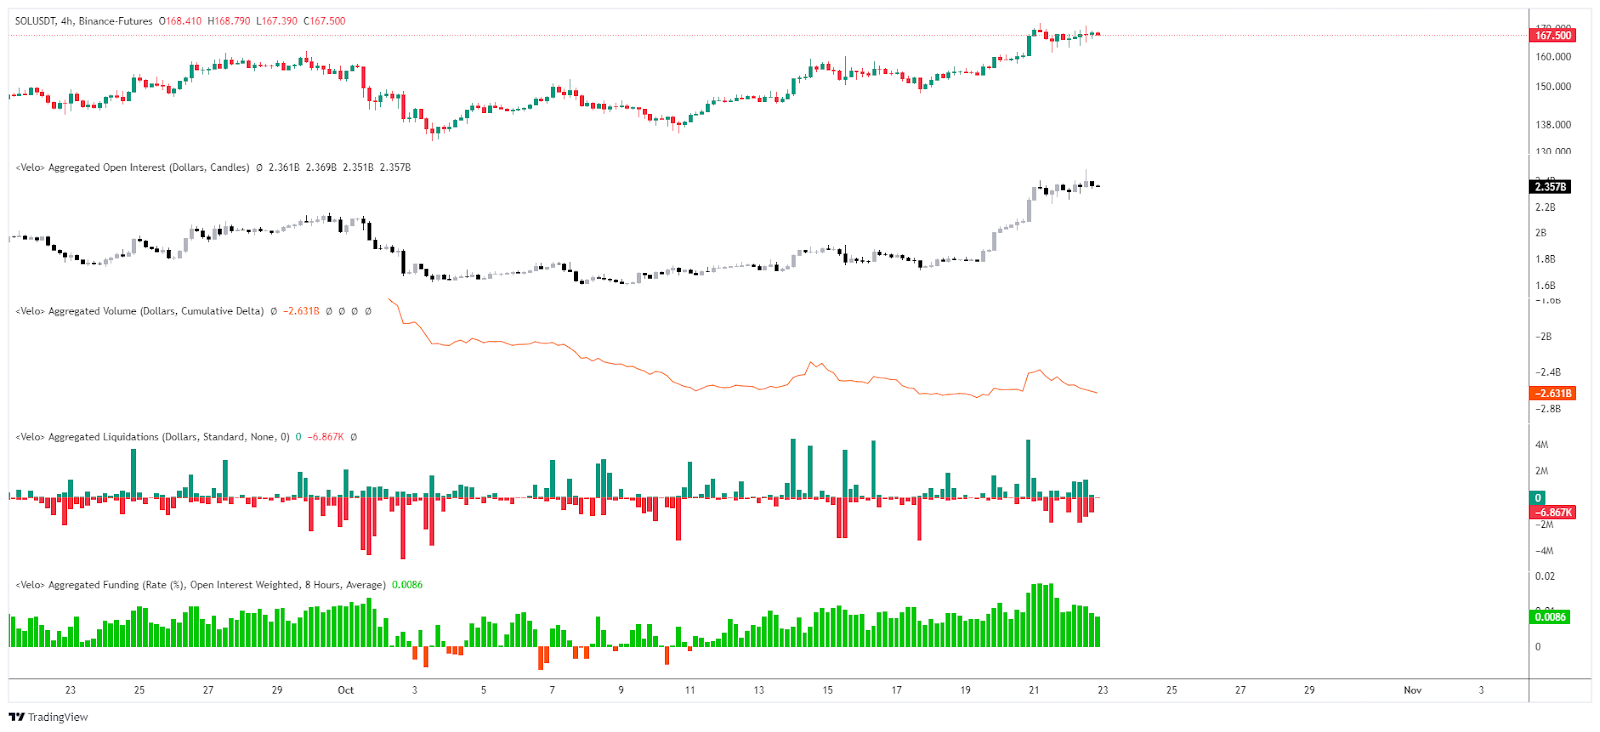
The open interest of SOL/USDT perpetual contracts has been revised upward, even more than its underlying. This undeniably demonstrates the interest of speculators in the crypto. Although this phenomenon is accompanied by a positive funding rate, indicating a majority of buyers on Solana perpetual contracts, it should be noted that the CVD of Solana perpetual contracts has recently been revised downward. This reveals recently predominant sell orders on the market, thus illustrating some pessimism about the short-term future of the crypto. Regarding liquidations, there is a spike in short position liquidations, which could paradoxically indicate a recent capitulation of sellers on the Solana price.
The liquidation heat map of SOL/USDT contracts reveals that the Solana price has recently crossed a significant liquidation zone. This crossing does not seem to have triggered sell orders that would have weighed on the price, thus suggesting a possible continuation of the bullish movement. Currently, the notable liquidation zones above the price are around $185, then $195. Below the current price, a zone is identified between $150 and $160. Lower still, another zone is found around $144. Finally, a key zone is located below $127. The approach of the price towards these levels could lead to a massive triggering of orders, thereby increasing the risk of heightened volatility for the cryptocurrency. These zones thus represent crucial points of interest for investors.

Forecasts for the Solana Price (SOL)
- If the Solana price remains above $147, we could anticipate a bullish continuation towards the $185 level. The next resistance to watch, if this movement is confirmed, could be around $195. Beyond that, the $200 zone would be a target to consider, representing an increase of over 19%.
- On the other hand, if Solana fails to maintain above $147, a return towards $145 would be possible. If the bearish movement continues, the next support to watch would be around $135. Even lower, we could aim for the support zone around $127, corresponding to a potential decrease of about 24%.
Conclusion
Solana shows clear signs of recovery with a confirmed bullish trend in the medium term after breaking through key resistance levels. The appearance of a reversal technical figure, combined with favorable indicators, reinforces this momentum, although it is necessary for the asset to maintain its momentum to sustainably confirm this movement. Thus, it will be essential to closely monitor the price reaction to key levels to validate or revise the current forecasts. Finally, let us remember that this analysis is based solely on technical criteria, and that the price of cryptocurrencies can evolve rapidly based on other more fundamental factors.
Maximize your Cointribune experience with our "Read to Earn" program! For every article you read, earn points and access exclusive rewards. Sign up now and start earning benefits.

Family Trading est une Communauté de traders a compte propre active depuis 2017 offrant Lives, contenus éducatifs et entraides autour des marchés financiers dont celui des cryptomonnaies avec à ses côtés Elie FT, investisseur et trader de passion sur le marché crypto.
The contents and products mentioned on this page are in no way approved by Cointribune and should not be interpreted as falling under its responsibility.
Cointribune strives to communicate all useful information to readers, but cannot guarantee its accuracy and completeness. We invite readers to do their research before taking any action related to the company and to take full responsibility for their decisions. This article should not be considered as investment advice, an offer, or an invitation to purchase any products or services.
Investment in digital financial assets carries risks.
Read more