Solana Down -40% Since Its Last ATH, What Levels To Watch? Technical Analysis From February 12, 2024
After reaching its highest historical level, Solana is facing downward pressure threatening its price. Discover Elyfe’s analysis to decrypt the technical perspectives of SOL.
Situation of Solana (SOL)
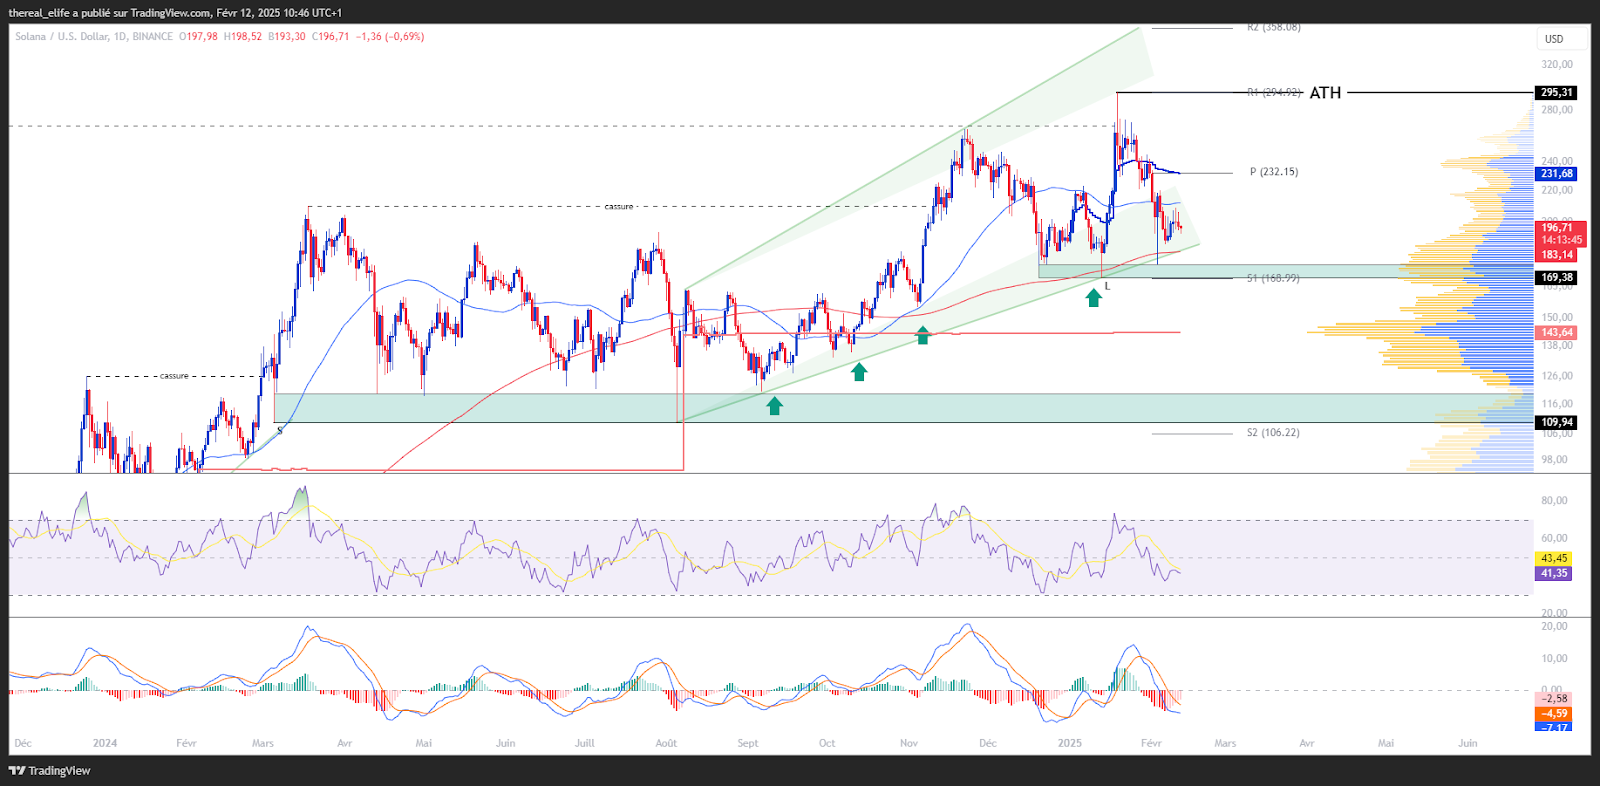
After breaking the resistance at $210, Solana continued its rise towards its latest ATH identified at $267. Upon reaching this level, the price of SOL experienced a decline, bringing it back to around $170, thus recording a correction of more than 36%.
Fortunately, this price level, supported by the 200-day moving average and the first pivot support, triggered buying interest that was maintained. This subsequently allowed it to surpass its previous peak and record a new historical high at $295.
Unfortunately, the rise of SOL was not sustained, partly due to the overall decline in the crypto market. It has recently found its support around $170.
At the time of writing, the price of Solana is trading around $196. It is above a significant value area, as well as above its 200-day moving average.
However, Solana is now below its annual VWAP, which coincides with its monthly pivot point at $232. Although the short-term trend remains bearish, the medium and long-term dynamics remain bullish.
This bullish structure is confirmed by the positioning of the 50 and 200-day moving averages, which remain crossed and oriented upwards, signaling a maintenance of the underlying trend despite the current consolidation.
On the bullish dynamic side of SOL, it is not surprising that it has been revised downwards, which is reflected in both its price and its oscillators.
The current technical analysis was done in collaboration with Elyfe, investor and popularizer in the cryptocurrency market.
Focus on Solana Derivatives (SOLUSDT)
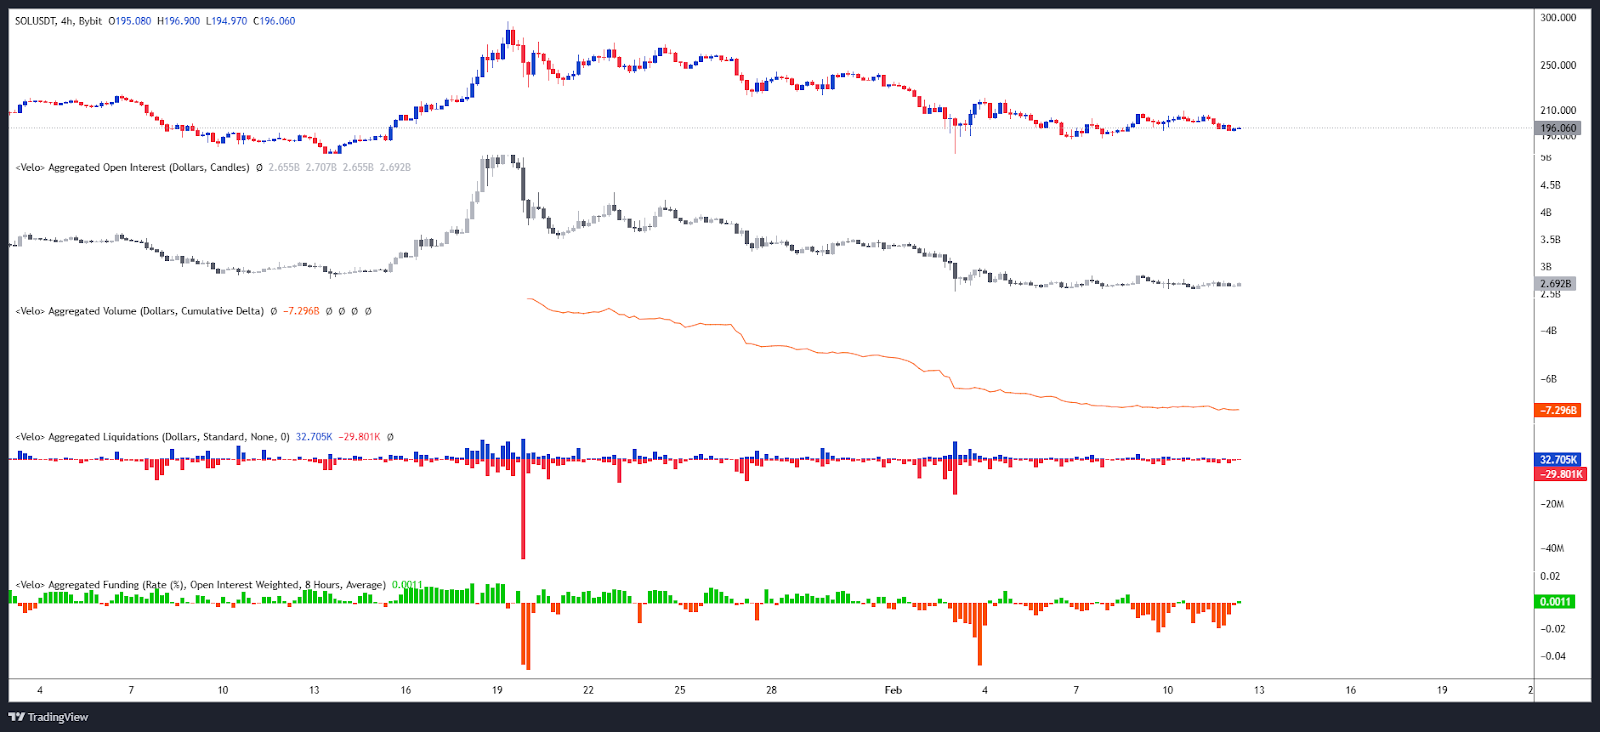
While the open interest in SOL/USDT perpetual contracts seems poised to stabilize, it has been revised downwards, following the trend of its underlying price. This reflects decreasing interest as the price of Solana declines.
On the CVD side, it is also declining, indicating a predominance of market sell orders, thus contributing to increased selling pressure.
The funding rate has gone into negative territory, reflecting bearish convictions.
Finally, since the peak of the long position liquidations on February 3, liquidations have remained limited on both sides of the market after the last correction of Bitcoin, with no significant movement for buyers or sellers. This situation indicates a stable market, controlled volatility, and careful risk management, reflecting a certain balance.
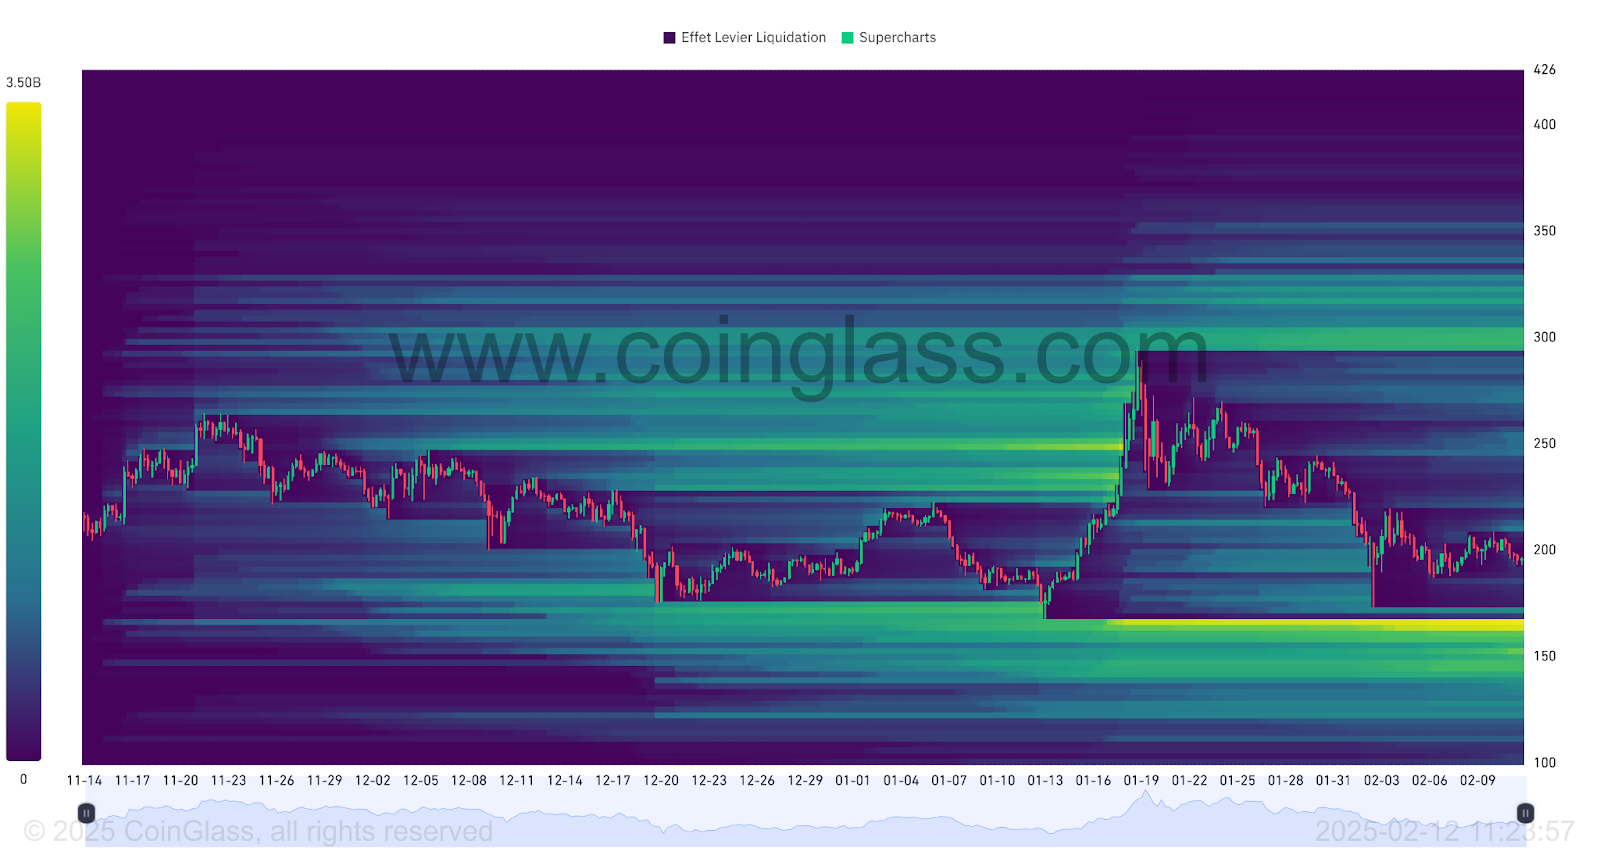
The heatmap of SOL/USDT contract liquidations reveals that the liquidation zone located below $300 has triggered sell orders due to the price decline. Although this zone remains visible, the most significant liquidation zone is below the current price of Solana, around $160.
The approach of price towards these levels could lead to a massive trigger of orders, thereby increasing the risk of heightened volatility for the crypto. These zones thus represent a crucial point of interest for investors.
Forecast for Solana Price (SOL)
- If the price of Solana remains above $170, we could anticipate a return towards $220 – $240. The next resistance to watch, if the bullish movement continues, would be around $270, or even a return towards the last ATH at $295. At this stage, that would represent an increase of over 50%.
- Conversely, if the price of Solana fails to hold above $170, a pullback to $155 is conceivable. The next support to consider, in case of a continuing bearish movement, could be between $140 and $130, or even around a medium and long-term support level close to $110. This would then represent a decrease of about 43%.
Conclusion
Solana shows notable resilience despite a correction phase, supported by key levels that have favored a rebound. Although the short-term trend remains uncertain, the underlying dynamics remain positive, indicating potential recovery in the medium and long term. In this context, it will be essential to closely monitor the price reaction at strategic levels to confirm or adjust the current forecasts. Finally, let us remember that these analyses are based solely on technical criteria, and the price of cryptocurrencies can evolve rapidly due to other more fundamental factors.
Did this study interest you? Find our latest Ethereum analysis.
Maximize your Cointribune experience with our "Read to Earn" program! For every article you read, earn points and access exclusive rewards. Sign up now and start earning benefits.

Spécialiste en analyse technique, Elyfe décrypte les tendances graphiques des marchés des cryptomonnaies avec une approche rigoureuse et en constante évolution. À travers ses analyses détaillées, il apporte un regard éclairé sur la dynamique des prix, aidant les investisseurs et passionnés à mieux comprendre et anticiper les mouvements du marché.
The contents and products mentioned on this page are in no way approved by Cointribune and should not be interpreted as falling under its responsibility.
Cointribune strives to communicate all useful information to readers, but cannot guarantee its accuracy and completeness. We invite readers to do their research before taking any action related to the company and to take full responsibility for their decisions. This article should not be considered as investment advice, an offer, or an invitation to purchase any products or services.
Investment in digital financial assets carries risks.
Read more