Ethereum Plunges Below $3,000: Warning Sign for Investors? Technical Analysis for February 6, 2025
Ethereum continues to face downward pressure, pushing its price down. Let’s analyze the future prospects of ETH.

Situation of Ethereum (ETH) price
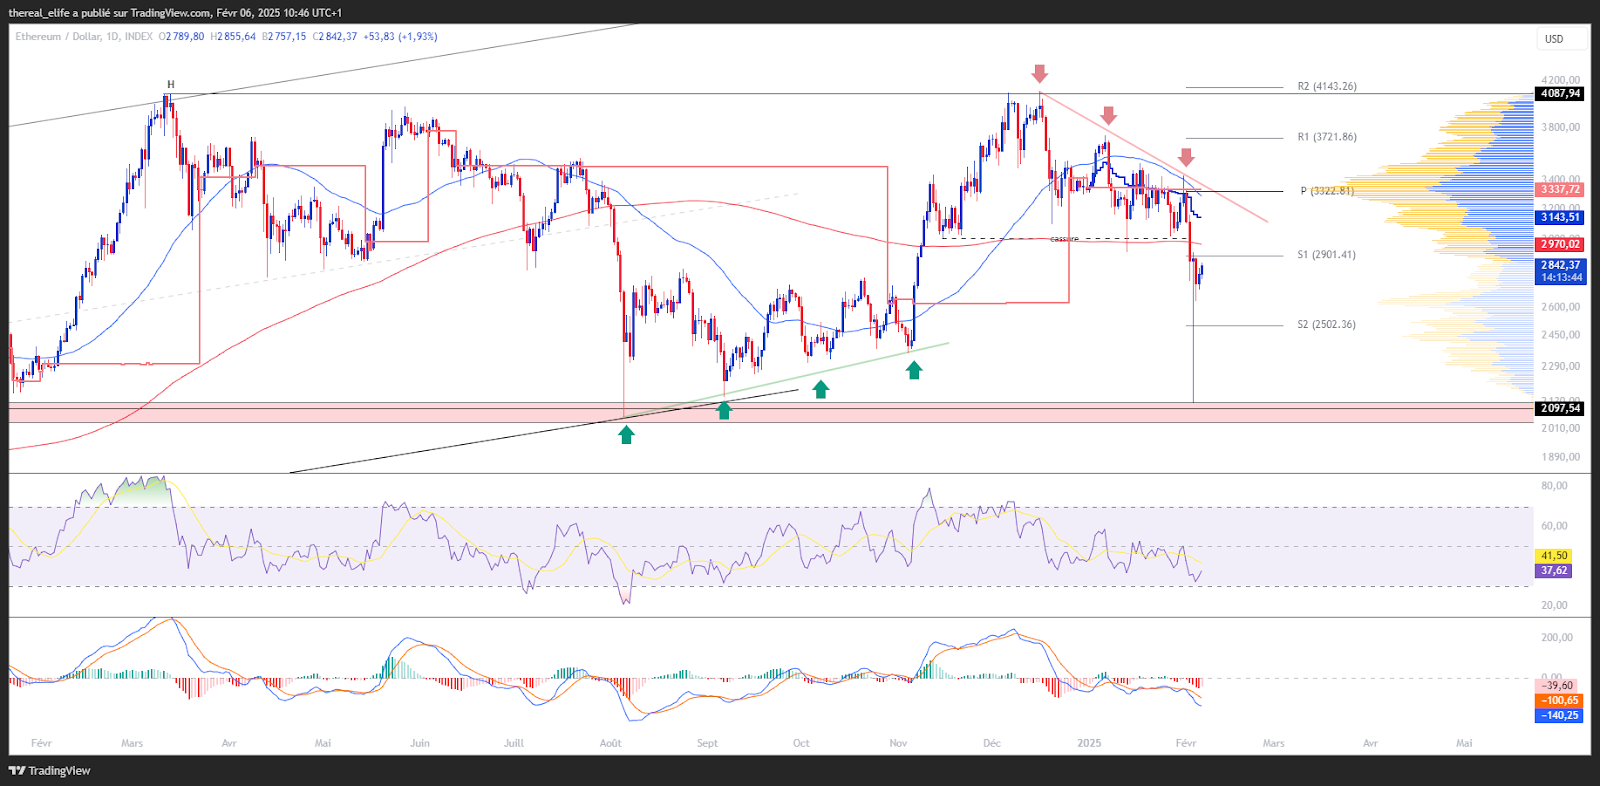
After reaching a peak of $4,100, Ethereum experienced a gradual decline in its price, bringing it down to the $2,900 support level, which was backed by the volume profile. While some interest appeared to be emerging, the overall downturn in the cryptocurrency market eventually led to the breakdown of this support level, causing a drop of around 30%. At the time of writing, Ethereum is trading around $2,800. Ethereum has thus erased all the gains it had made since the beginning of November 2024. It was around the $2,125 level that Ethereum showed renewed interest, leading to a rebound in its price. It is worth noting that this price level corresponds to an already established support.
At the time of writing this text, the Ethereum price is trading around $2,800. The asset is currently in a downward trend in the short and medium term. This is particularly reflected by the price returning below its moving averages, which seem about to cross downwards.
On the ETH side, unsurprisingly, its dynamics have continued to be revised downwards. This phenomenon is perceived as much on the price of Ethereum as on its oscillators.
The current technical analysis was conducted in collaboration with Elyfe, an investor and influencer in the cryptocurrency market.
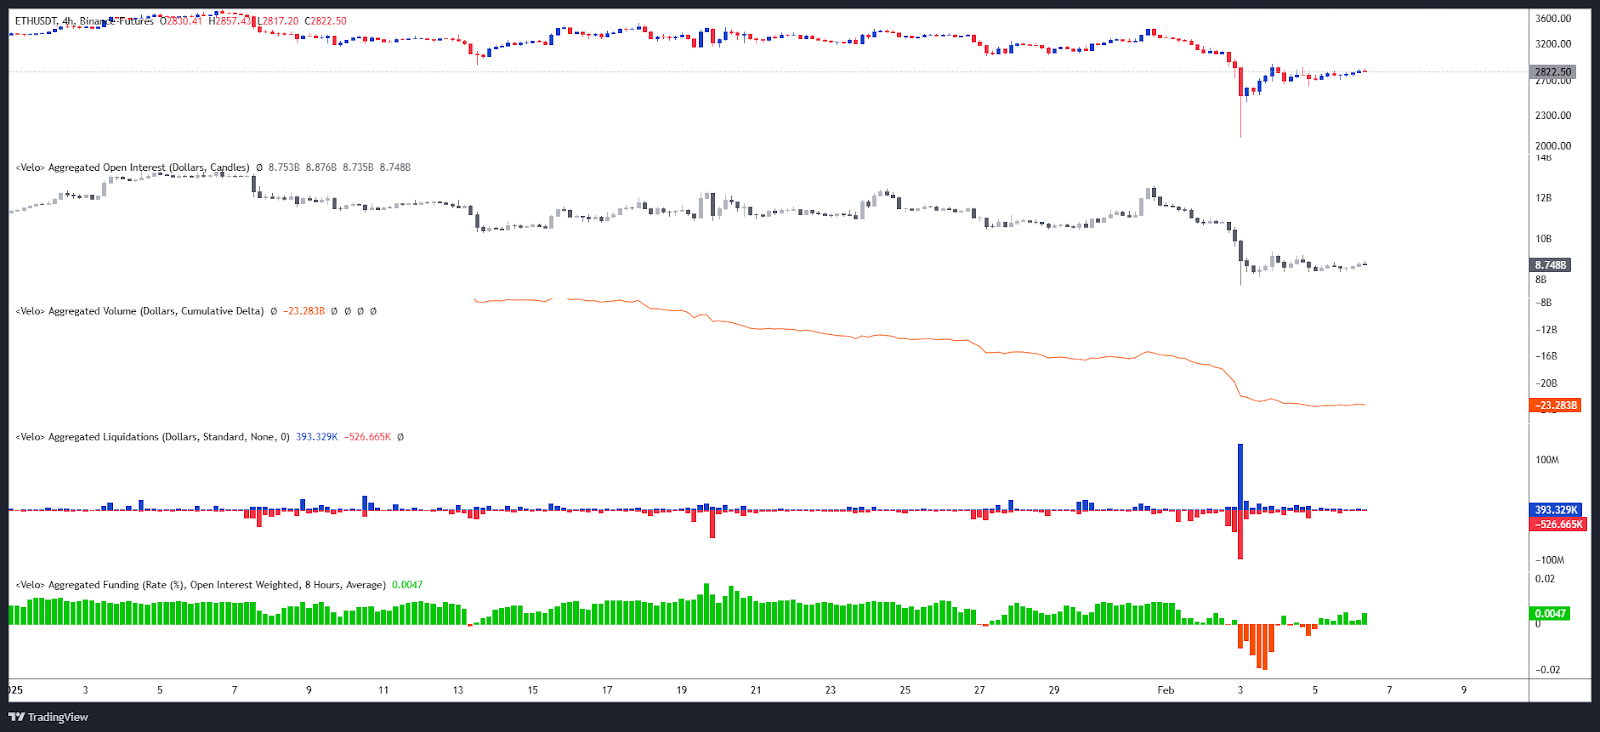
Focus on Derivatives (ETHUSDT)
The open interest in ETH/USDT perpetual contracts has decreased, following the trend of the underlying price, indicating diminishing interest as the price of ETH declines.
On the CVD side, it is also decreasing, indicating a predominance of market sell orders, thus contributing to notable selling pressure.
Unsurprisingly, the funding rate has moved into negative territory, reflecting bearish convictions.
Finally, we observe a spike in long position liquidations and, paradoxically, short positions as well. This phenomenon illustrates aggressive behavior from market players, exacerbated by volatility.
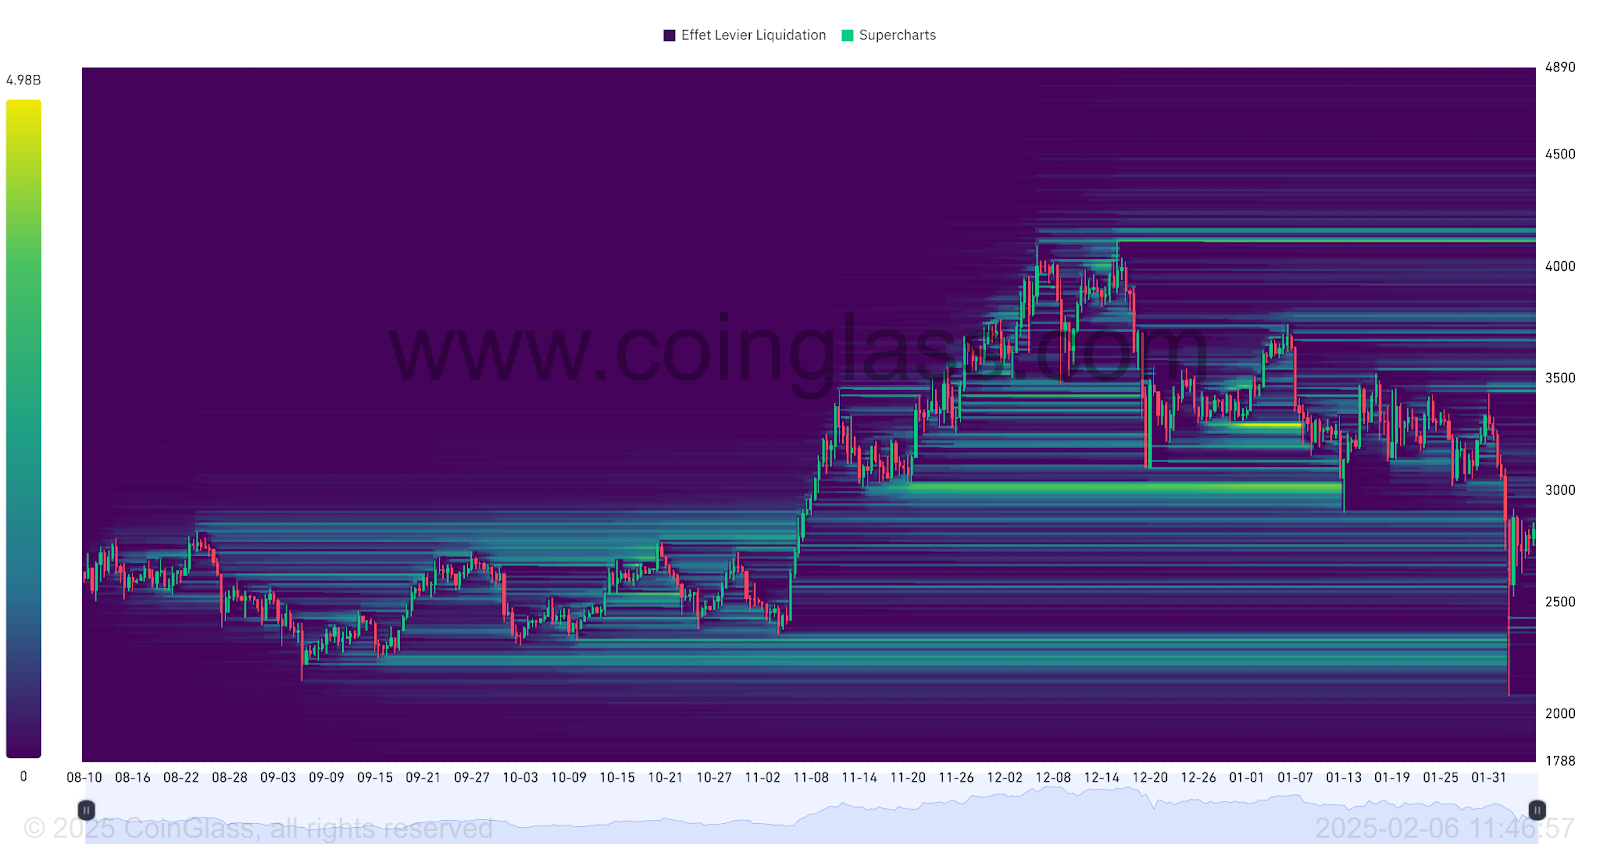
The liquidation heatmap of ETH/USDT shows that Ethereum has bounced off a significant liquidation zone, ranging between $2,300 and $2,200. This zone seems to have triggered buyer orders, as evidenced by the observed reaction.
Currently, the visible liquidation zones appear much less significant. Nevertheless, the levels of $3,550, $3,700 — $3,800, and finally $4,120, the latter being the most notable, can be noted.
A price approach towards these levels could trigger massive orders, thereby increasing the volatility risk for the cryptocurrency, making them major points of interest for investors.
Forecast for Ethereum (ETH) price
- If the price of Ethereum stays above the $2,640 zone, a break of $2,900, or even $3,000, could be anticipated, paving the way towards $3,500. In case of a continuation of this bullish movement, reaching $3,700, or even $4,000, could be considered, representing a rise of around 40%.
- If Ethereum fails to hold above $2,640, a pullback towards $2,460 could occur. Should the decline continue, the next key support is just below $2,125. Even lower, the psychological zone of $2,000 could act as support, which would represent a decline of around 30%.
Conclusion
Ethereum remains under pressure despite a recent rebound, still evolving in a downward trend. Market dynamics show signs of weakness, limiting short-term recovery prospects. A resurgence of buyer confidence will be essential to reverse this trend. Therefore, it will be crucial to closely monitor the price reaction at key levels to validate or adjust current forecasts. Let’s remember that this analysis is based solely on technical criteria and that the cryptocurrency market remains sensitive to various fundamental factors.
Did this study interest you? Check out our latest Bitcoin analysis from February 5.
Maximize your Cointribune experience with our "Read to Earn" program! For every article you read, earn points and access exclusive rewards. Sign up now and start earning benefits.

Spécialiste en analyse technique, Elyfe décrypte les tendances graphiques des marchés des cryptomonnaies avec une approche rigoureuse et en constante évolution. À travers ses analyses détaillées, il apporte un regard éclairé sur la dynamique des prix, aidant les investisseurs et passionnés à mieux comprendre et anticiper les mouvements du marché.
The views, thoughts, and opinions expressed in this article belong solely to the author, and should not be taken as investment advice. Do your own research before taking any investment decisions.