Bitcoin in Free Fall: Is a Rebound on the Horizon? Technical Analysis for March 4, 2025
After falling below $90,000, bitcoin faced selling pressure, resulting in a drop of nearly 14%. Check out Elyfe’s analysis to decipher BTC’s technical outlook.

Bitcoin (BTC) Price Situation
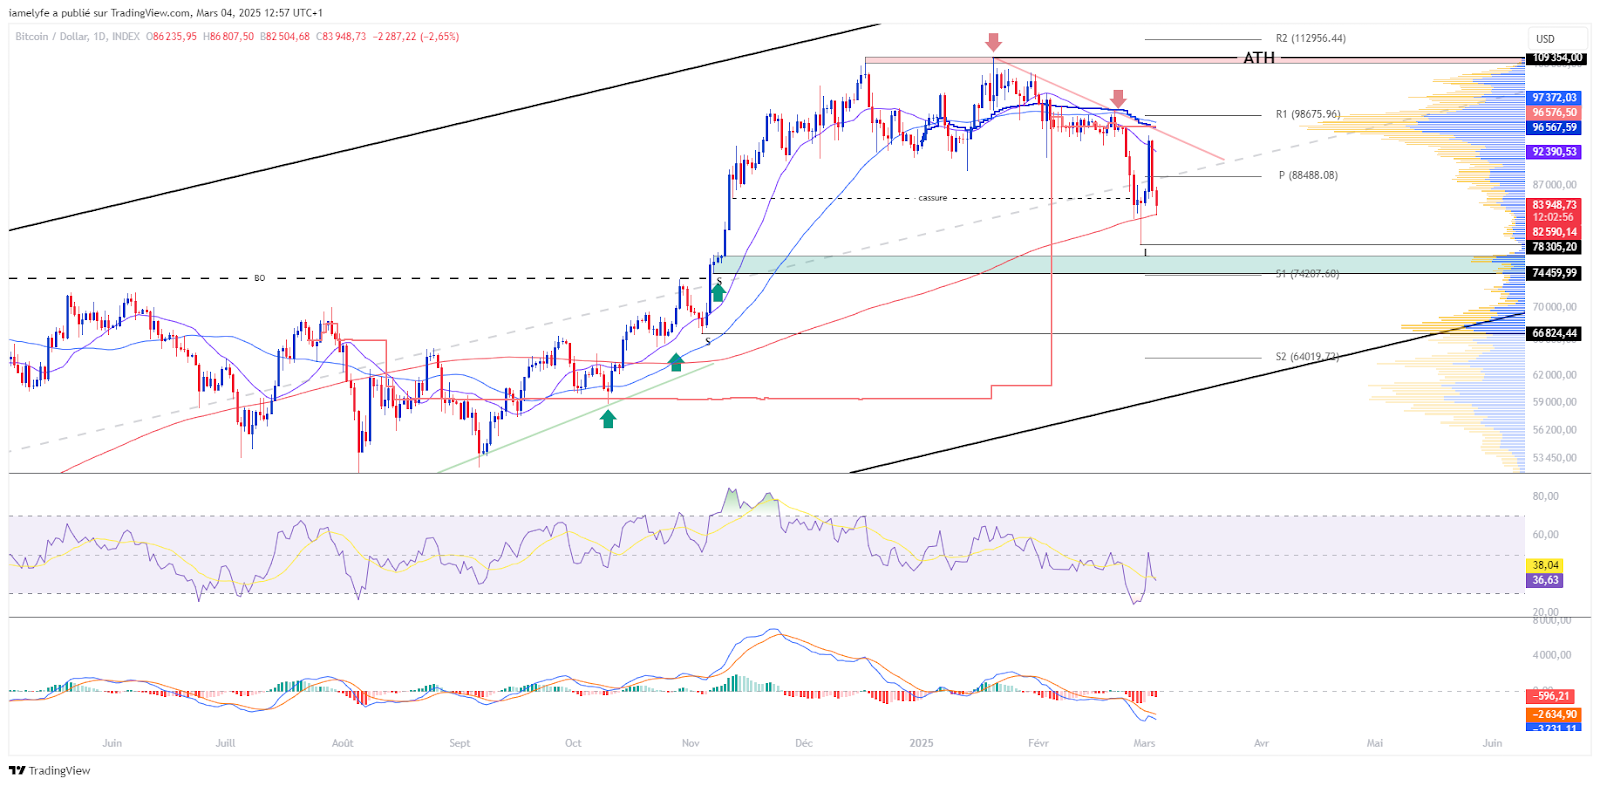
After breaking the support of $90,000, bitcoin faced selling pressure, amplifying its bearish move by nearly 14% and bringing its price down to $78,200. Therefore, the bearish hypothesis presented in the February 25 analysis has come to fruition.
Fortunately, the announcement by Donald Trump regarding cryptocurrency reserves allowed bitcoin to bounce back to this level. Following this news, BTC surged by over 23%, quickly reaching $96,700, a level corresponding to a value area, located just below the annual VWAP as well as the 200-day moving average.
Unfortunately, this drop was absorbed at the beginning of the week. Indeed, although this rise rekindled hope for a market recovery, bitcoin’s price faced new bearish pressure, impacting its price downward once again.
At the time of writing, bitcoin is trading around $83,700. It seems to be holding in a subtle support zone at the level of the 200-day moving average. Its upward orientation indicates a long-term bullish trend. However, the short and medium-term trend has clearly turned bearish again, as evidenced by Dow’s theory as well as the 50-day and 20-day moving averages, which are tilted downward.
The bullish momentum of bitcoin has slightly rebounded but remains overall revised downward. This is reflected both in its price and in its oscillators, which have reached new lows.
The current technical analysis has been conducted in collaboration with Elyfe, an investor and popularizer in the cryptocurrency market.
Focus on Derivatives (BTC/USDT)
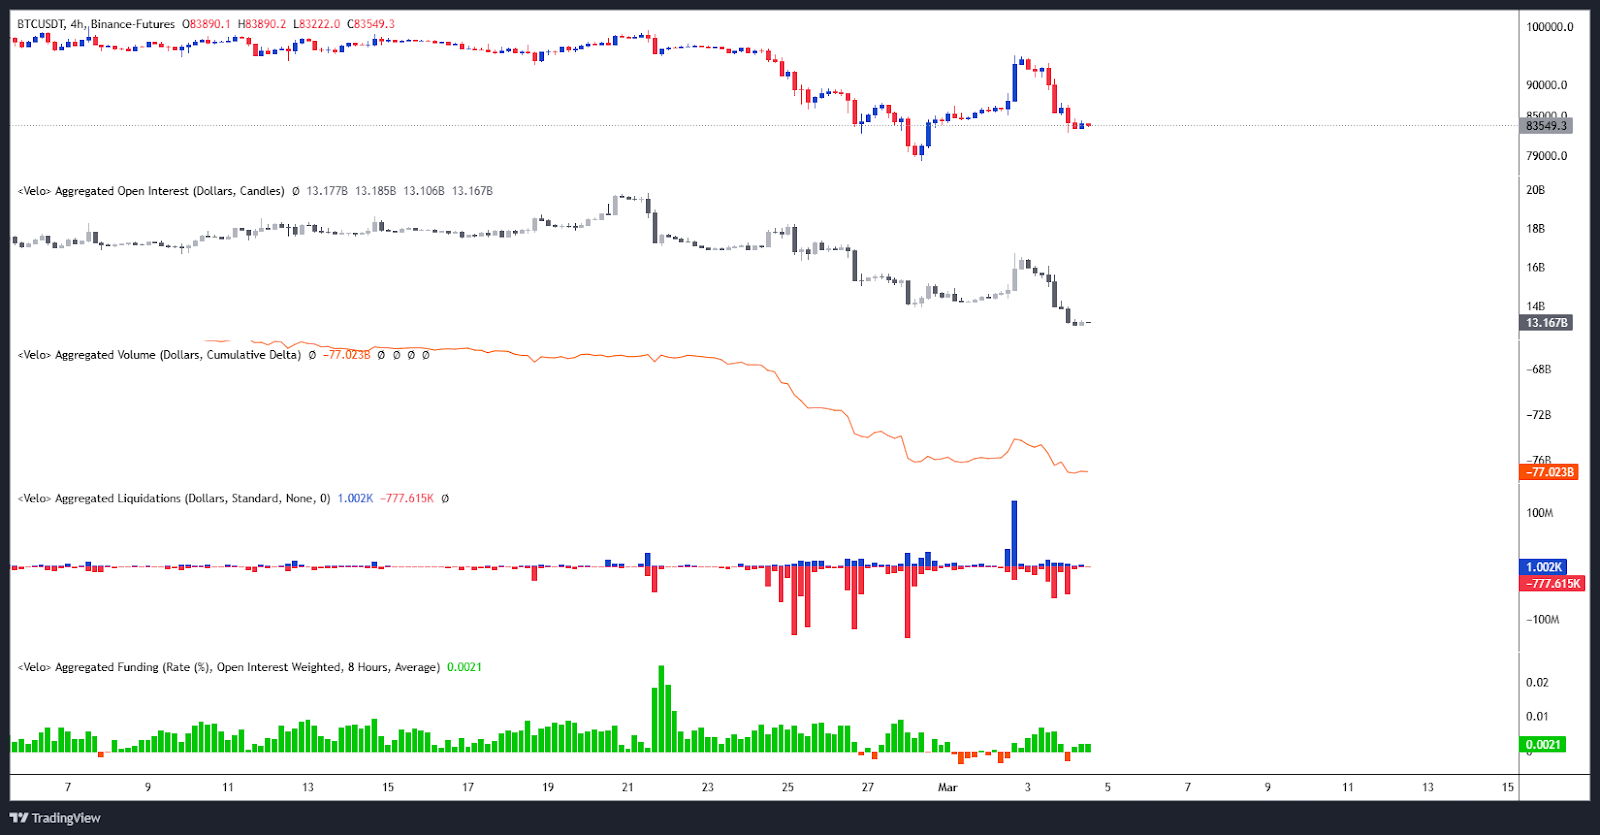
The bearish retracement of BTC has led to a decline in open interest as well as the funding rate, suggesting a gradual exit of positions in BTC/USDT perpetual contracts, particularly buyers.
Similarly, the CVD has continued to decline, demonstrating a predominance of sell orders in the ongoing market. This dynamic indicates a continuation of seller aggression, illustrating strong selling pressure from investors.
Although a spike in sell liquidations was observed during the last rebound of BTC, these mainly concern buy positions. This situation reflects the dominance of sellers as well as increased volatility, weakening the buying strength in the market.
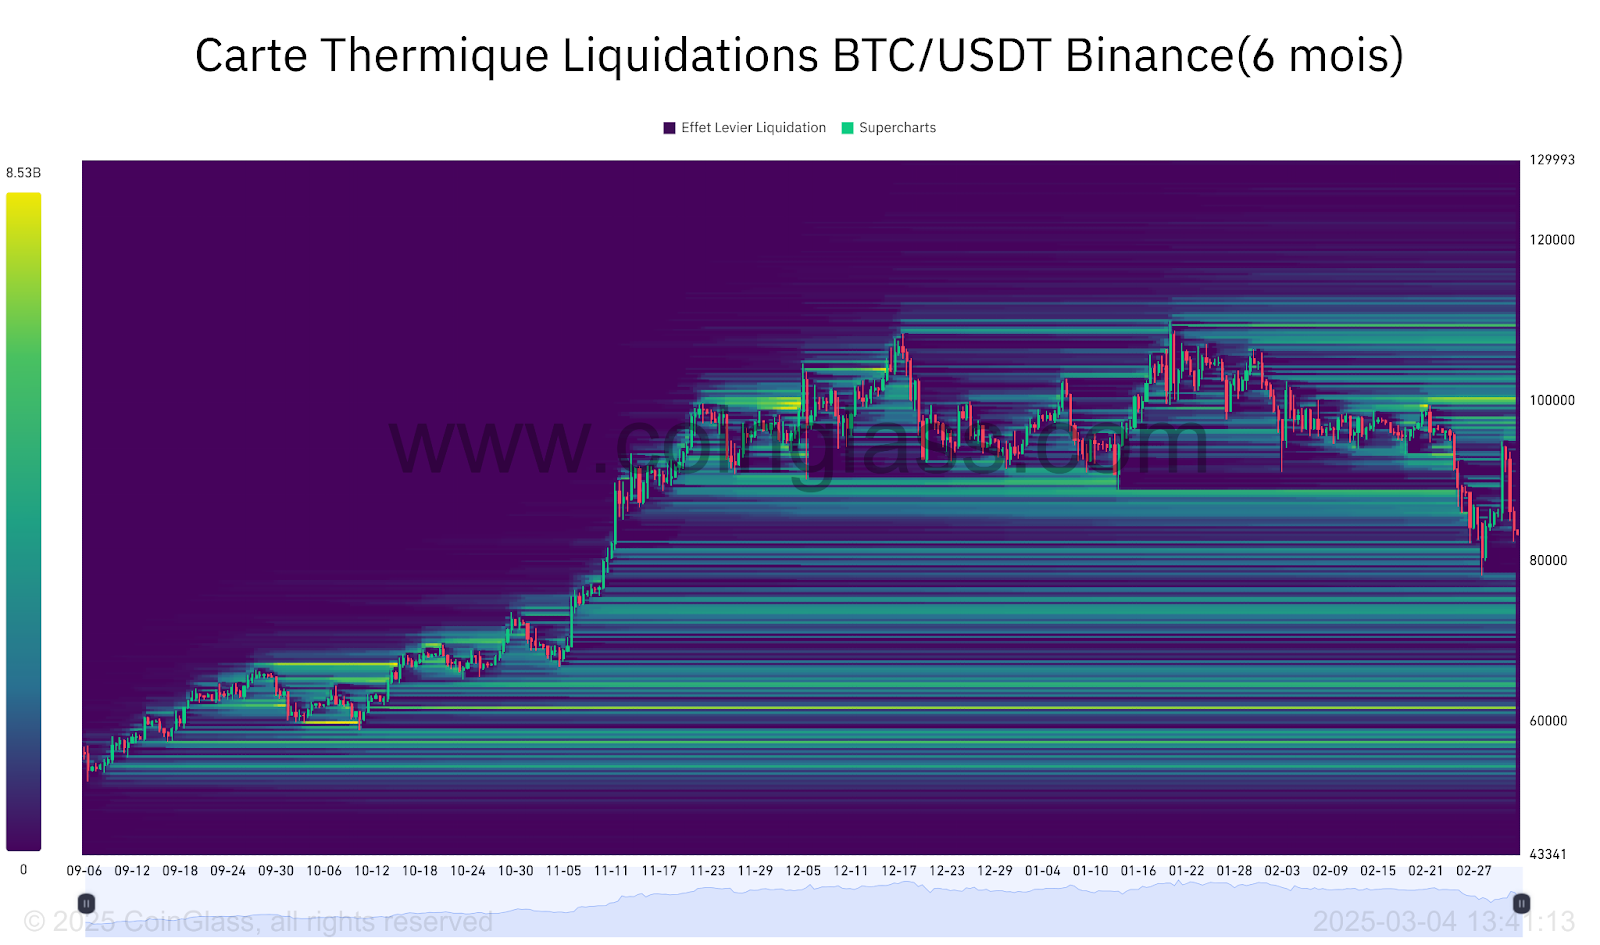
The liquidation heat map of BTC/USDT perpetual contracts reveals that bitcoin reached a liquidation zone identified around $78,000. Buyer interest seems to have manifested, as evidenced by the price rebound at this level.
Currently, the key liquidation zones are located on either side of the current price.
- Above, a first liquidation zone is identified between $95,000 and $98,000, followed by a larger zone around $100,000. The latter extends up to $104,000 and precedes another zone between $107,000 and $111,000.
- Below, we can again note the liquidation zone around $78,000. Lower down, a more pronounced zone is situated around $74,000. This precedes an even more pronounced zone between $67,000 and $61,000.
These thresholds constitute major inflection points for the market. An approach of the price towards these levels could trigger massive order activation, thus playing a key role in the upcoming movements, depending on the dynamics of supply and demand.
Forecasts for Bitcoin (BTC) Price
- If bitcoin manages to hold above $83,300, a recovery could allow it to re-enter $96,500, thereby opening the way towards resistance at $99,400, even $100,000. Breaking this threshold would then favor a return towards $106,000, then towards its ATH at $109,354, representing an increase of about 30%.
- If bitcoin fails to hold above $83,300, it could find support around $78,200. A prolonged drop would then bring its price down to the threshold of $76,000, even $72,800. Finally, breaking this level could lead to another drop towards the zone of $67,000, representing a decrease of around 20%.
Conclusion
Bitcoin is undergoing a phase of high volatility, alternating between rebounds and corrections. Despite a resurgence of hope, selling pressure persists, limiting any sustainable recovery. In the short term, uncertainty dominates, and only a more assertive signal could reverse the current trend. In this context, it will be essential to closely monitor price reactions at strategic levels to confirm or adjust current forecasts.
Finally, it is worth noting that these analyses are based solely on technical criteria, and the price of cryptocurrencies can evolve rapidly based on other more fundamental factors.
Did you find this study interesting? Check out our latest Litecoin analysis.
Maximize your Cointribune experience with our "Read to Earn" program! For every article you read, earn points and access exclusive rewards. Sign up now and start earning benefits.

Spécialiste en analyse technique, Elyfe décrypte les tendances graphiques des marchés des cryptomonnaies avec une approche rigoureuse et en constante évolution. À travers ses analyses détaillées, il apporte un regard éclairé sur la dynamique des prix, aidant les investisseurs et passionnés à mieux comprendre et anticiper les mouvements du marché.
The contents and products mentioned on this page are in no way approved by Cointribune and should not be interpreted as falling under its responsibility.
Cointribune strives to communicate all useful information to readers, but cannot guarantee its accuracy and completeness. We invite readers to do their research before taking any action related to the company and to take full responsibility for their decisions. This article should not be considered as investment advice, an offer, or an invitation to purchase any products or services.
Investment in digital financial assets carries risks.
Read more