Bitcoin Exceeds $69,000 - Return Of The Bull Market? Analysis Of October 22, 2024
Bitcoin continues its rise and validates a promising technical breakout. Let’s examine the upcoming prospects for the BTC price together.

Bitcoin (BTC) Price Situation
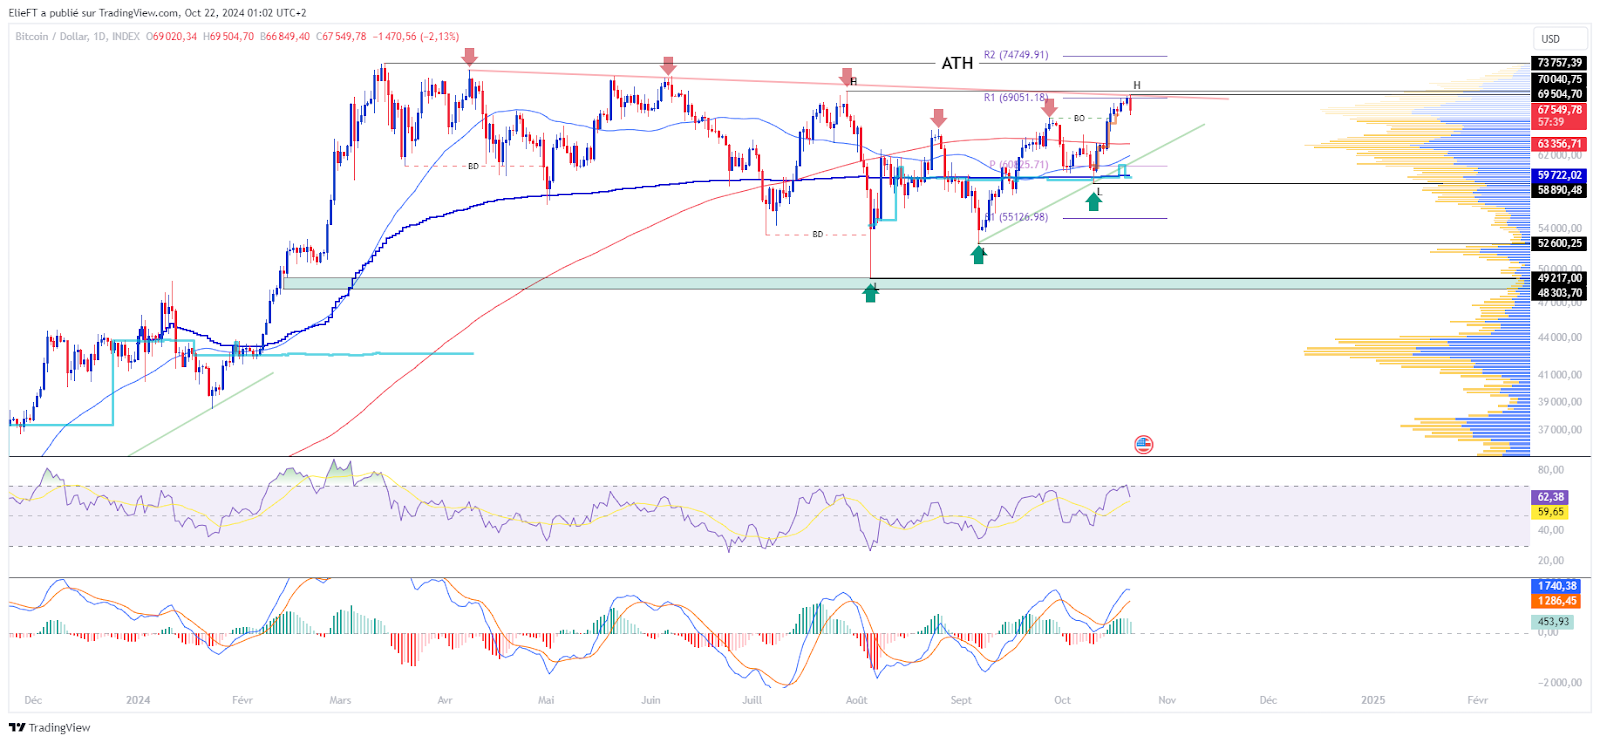
After bouncing back from the 60,000 $ support, Bitcoin crossed the 64,500 $ mark. It then quickly surpassed its daily resistance, identified around 66,500 $. From a technical analysis perspective, all these fluctuations have formed a cup with handle pattern, suggesting a potentially bullish future. Furthermore, this phenomenon confirms the return of a medium-term uptrend for the cryptocurrency. Subsequently, the bullish momentum was maintained until reaching 69,500 $. Unfortunately, this Monday, October 21st, a selling movement hindered this growth. It is worth noting that this decline occurred from the first resistance of the monthly pivot points.
At the time of writing this text, the Bitcoin price is trading around 67,800 $. The short-term trend has thus been called into question. Nevertheless, it is interesting to note a recent bounce from the 66,700 $ support. Although this decline may be concerning, it does not undermine the medium and long-term bullish trend of Bitcoin. In fact, Bitcoin is still positioned above its 50 and 200-day moving averages, which appear to be gradually turning upwards. Regarding the cryptocurrency’s dynamics, it was revised upwards before subtly retracting at the beginning of the week, as evidenced by its oscillators as well as the Bitcoin price itself.
The current technical analysis was conducted in collaboration with E, an investor and passionate trader in the cryptocurrency market. Today an instructor at Family Trading, a community of thousands of proprietary traders active since 2017. There you will find live sessions, educational content, and mutual assistance around financial markets in a professional and warm atmosphere.
Focus on Derivatives (BTCUSDT)
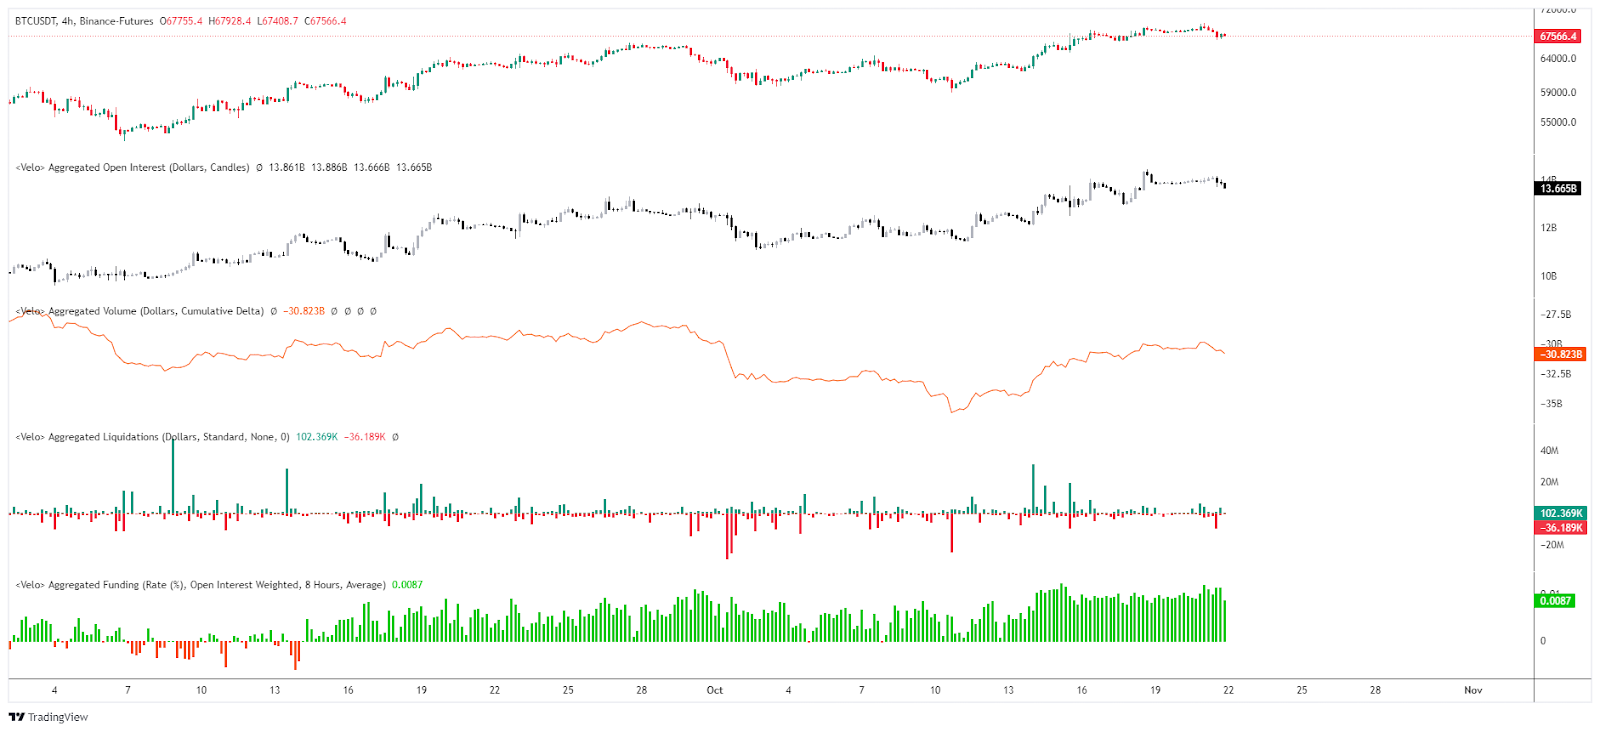
The open interest in perpetual BTC contracts as well as its CVD have generally evolved in line with its underlying asset. This shows a growing interest from speculators, mostly on the buy side. However, the recent drop in this interest suggests selling pressure. Regarding funding rates, we can see that they remain positive, illustrating persistent bullish pressure on Bitcoin perpetual contracts. As for liquidations, they are mostly on the buy side at the beginning of the week, although they are not significant.
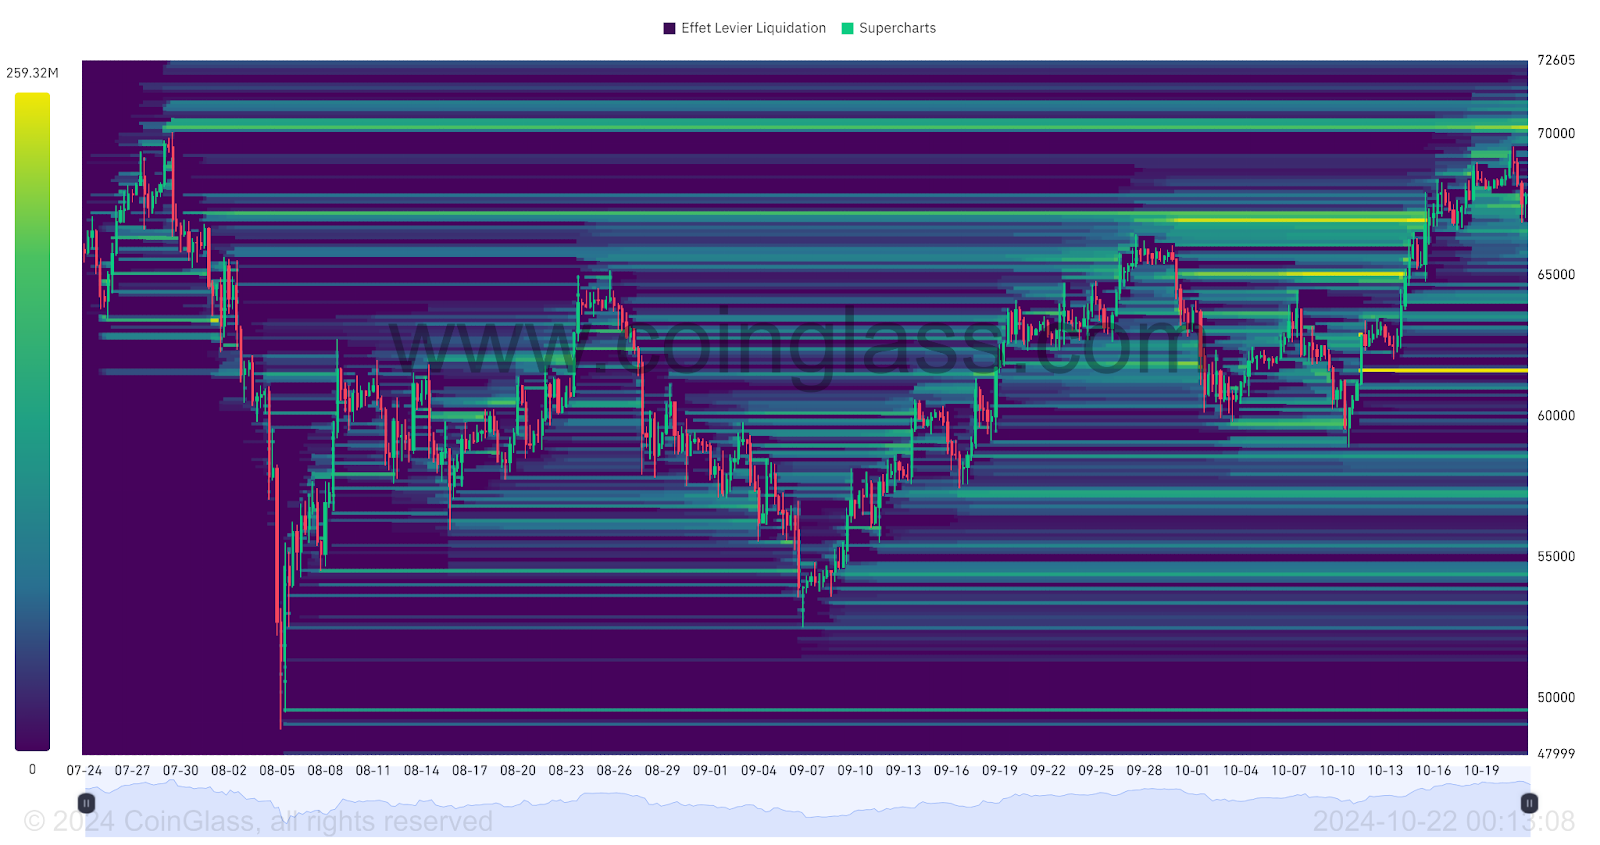
The liquidation heatmap indicates that BTC/USDT is currently in contact with a significant liquidation zone, located between 68,000 $ and 66,000 $. Buyer interest for the cryptocurrency seems to have been present, with the price bouncing back. Now, the most important liquidation zone is just above the current price, around 70,000 $. Higher up, we can note the zone above 72,000 $. Below the current price, there appears to be a subtle zone between 64,000 $ and 63,000 $. Lower down, we note the area close to 61,600 $. The approach of the price towards these levels could trigger a massive execution of orders, subsequently increasing the risk of heightened volatility for the cryptocurrency. Therefore, these zones represent a crucial point of interest for investors.
Forecasts for the Bitcoin (BTC) Price
- If the Bitcoin price stays above 66,500 $, we could anticipate a return towards 69,500 $. Breaking through this zone could lead to 70,000 $. If the bullish movement continues, we could foresee a progression up to 72,000 $. Higher up, we note Bitcoin’s ATH, which is around 73,760 $. Reaching this level would represent an increase close to 8 %.
- If Bitcoin fails to maintain above 66,500 $, we could consider a return towards 65,000 $ or even 64,000 $. The next support to watch, in case of a continued bearish movement, would be around 62,000 $ or even 61,600 $. Lower, we can note the support around 60,000 $. Reaching this last level would represent a decrease of approximately 11 %.
Conclusion
Despite a temporary retracement at the beginning of the week, calling into question Bitcoin’s short-term trend, the cryptocurrency’s bullish momentum remains intact, supported by technical elements confirming a positive medium and long-term trend. Although this fuels optimism, it remains essential to closely monitor the price’s reaction to key levels to validate or adjust current forecasts. Finally, let us remind that these analyses are based solely on technical criteria, and that the price of cryptocurrencies can evolve rapidly due to other more fundamental factors.
Maximize your Cointribune experience with our "Read to Earn" program! For every article you read, earn points and access exclusive rewards. Sign up now and start earning benefits.

Family Trading est une Communauté de traders a compte propre active depuis 2017 offrant Lives, contenus éducatifs et entraides autour des marchés financiers dont celui des cryptomonnaies avec à ses côtés Elie FT, investisseur et trader de passion sur le marché crypto.
The contents and products mentioned on this page are in no way approved by Cointribune and should not be interpreted as falling under its responsibility.
Cointribune strives to communicate all useful information to readers, but cannot guarantee its accuracy and completeness. We invite readers to do their research before taking any action related to the company and to take full responsibility for their decisions. This article should not be considered as investment advice, an offer, or an invitation to purchase any products or services.
Investment in digital financial assets carries risks.
Read more