Bitcoin Drops Below $100,000: Should We Be Worried? January 5, 2025 Technical Analysis
After reaching a new ATH of $109,354, Bitcoin is facing selling pressure, leading to a decline in its price. Let’s examine the technical outlook for BTC together.

Current Bitcoin Price Situation (BTC)
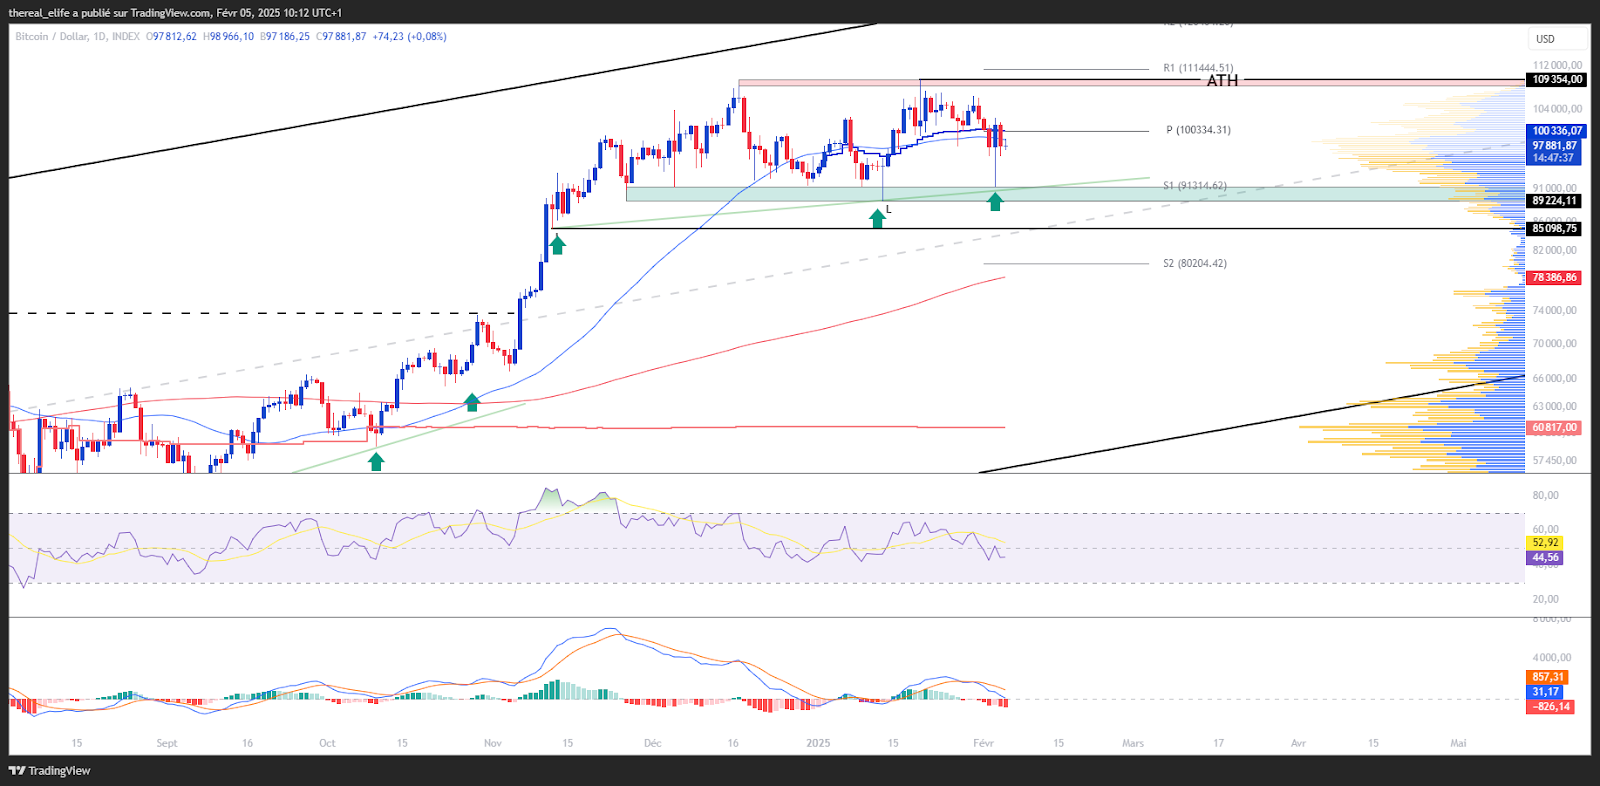
After reaching an all-time high of $109,354, Bitcoin experienced marked volatility, bringing its price back toward the support level of $100,000. Unfortunately, although buying interest has emerged, it has not been sufficient to halt the decline. It is at the first pivot support level, located around $91,350, that BTC’s price has found refuge.
It is worth noting that this correction has been exacerbated by various events, such as the plunge in Nvidia’s stock price or, more recently, by the resumption of the trade war by Donald Trump.
As concerning as it may seem, it is important to note that Bitcoin has not breached its value zone, nor its support level between $90,000 and $89,000. Naturally, this leaves room for hope for a potential price recovery.
At the time of writing this text, the Bitcoin price is trading around $97,600. Although short-term trends seem to have turned bearish, medium and long-term trends remain bullish. This observation is confirmed by the positioning of the 50-day and 200-day moving averages, which are crossed and oriented upwards. Nevertheless, Bitcoin is now positioned below its annual VWAP, located at the same level as its monthly pivot point at $100,334.
On the bullish momentum side for BTC, it is not surprising that it has weakened as its price has declined. This is reflected in both its price and its oscillators.
The current technical analysis has been carried out in collaboration with Elyfe, an investor and communicator in the cryptocurrency market.
Focus on Derivatives (BTC/USDT)
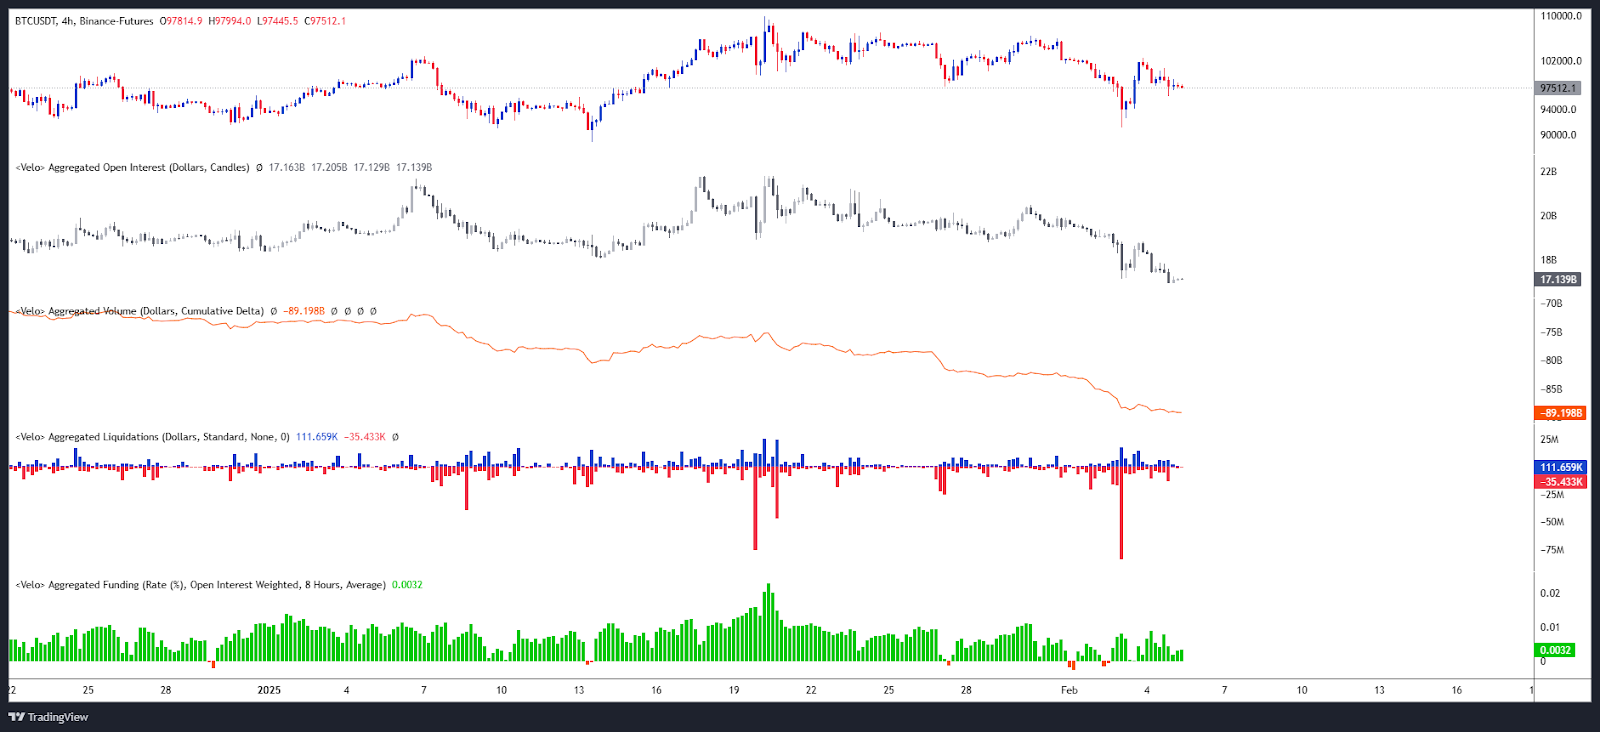
Open interest, CVD, and the funding rate of BTC/USDT perpetual contracts have all been revised downwards, just like the price of their underlying asset, indicating genuine selling pressure on the cryptocurrency. However, although the price of BTC/USDT contracts shows signs of recovery, this increase is not yet accompanied by a notable rise in these indicators, which could reflect a lack of enthusiasm or buying interest at this stage.
On the liquidation side, the recent decline led to significant liquidations of buying positions, marking a capitulation of buyers. Nevertheless, the observed rebound suggests a gradual resurgence of interest, which may herald a more sustainable recovery as it consolidates.
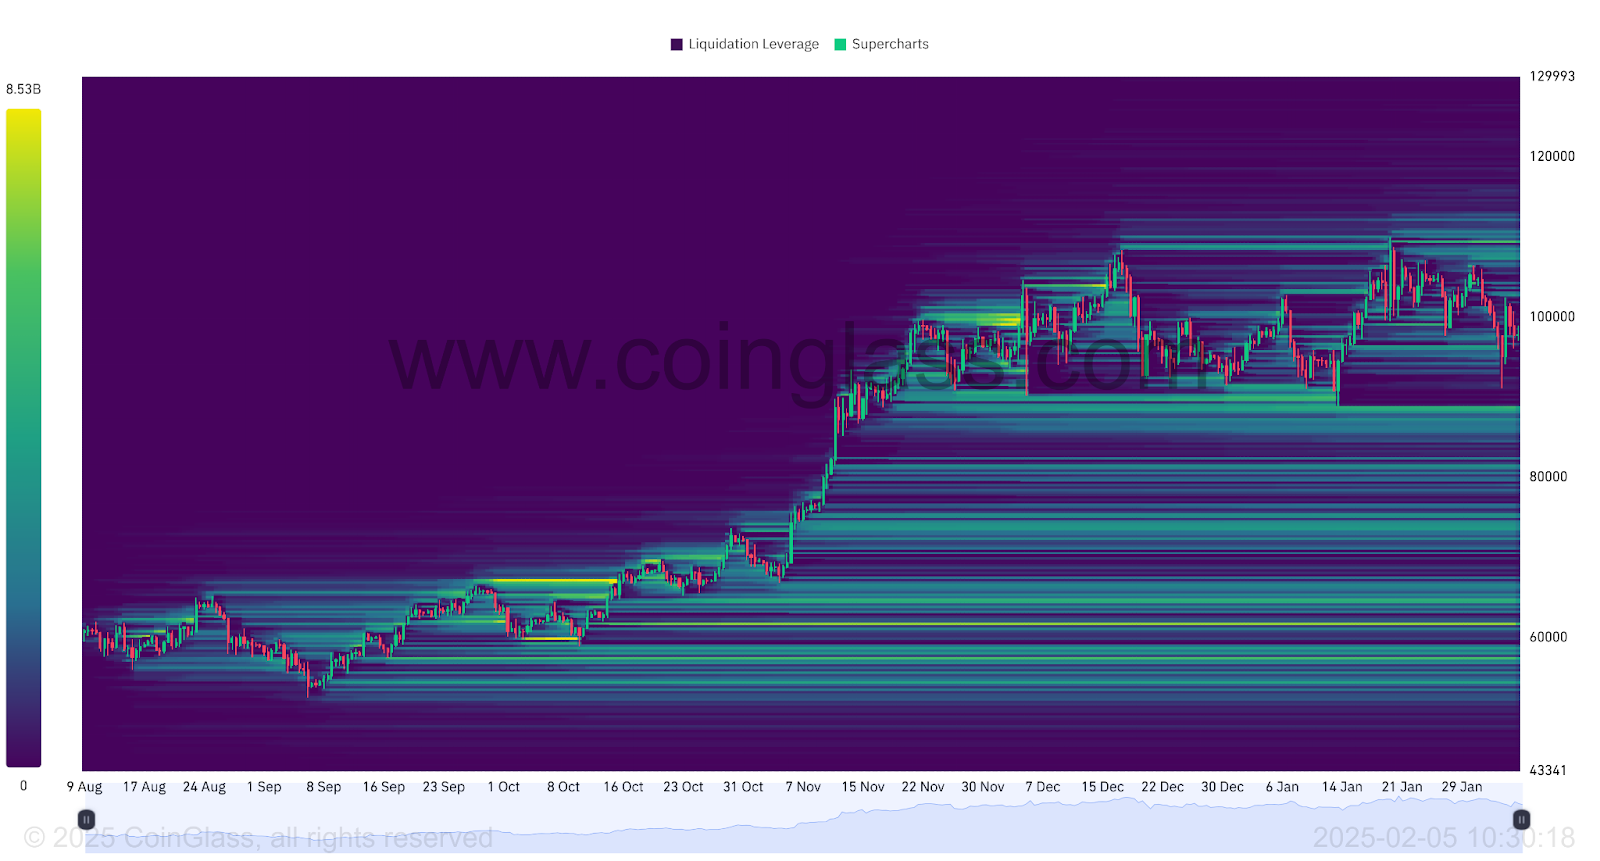
The heatmap of BTC/USDT perpetual contract liquidations shows that Bitcoin reached a significant liquidation zone below $96,000 before seeing its price bounce back. This price level thus attracted notable buying interest.
Currently, the most significant liquidation zones above the current BTC price are around $103,000, $107,000, and $108,000, with an even more critical level at $109,500. Conversely, below the current price, key zones appear below $89,000, while the next major zone is much lower, around $80,000 and $75,000.
If the price approaches these levels, it could trigger a large number of orders, thereby increasing the risk of volatility for the cryptocurrency. These zones thus represent crucial points of interest for investors.
Forecasts for Bitcoin Price (BTC)
- If Bitcoin manages to stay above $91,300, a recovery could allow it to break through $102,400, thus paving the way for reaching $106,000. Exceeding this threshold could then favor a return to its ATH at $109,354, representing an increase of about 12%.
- Conversely, if Bitcoin cannot stay above $91,300, it might find support around $89,450. A prolonged decline would then bring its price back toward the support level of $85,200. Finally, breaking this level could lead to a further drop to the $81,000 – $80,000 range, or even below $75,000, representing a decline of about 23%.
Conclusion
Bitcoin has experienced high volatility after its historical peak, undergoing a correction influenced by external factors. Despite marked bearish pressure, it has preserved a key zone, suggesting a continuation of the bullish trend in the medium and long term. In this context, it will be crucial to closely monitor price reactions at strategic levels to confirm or adjust current forecasts.
Let us remind you that this analysis relies solely on technical criteria and that the cryptocurrency market remains sensitive to numerous fundamental factors. At the same time, other dynamics deserve attention. Check out our latest analysis from January 23.
Maximize your Cointribune experience with our "Read to Earn" program! For every article you read, earn points and access exclusive rewards. Sign up now and start earning benefits.

Spécialiste en analyse technique, Elyfe décrypte les tendances graphiques des marchés des cryptomonnaies avec une approche rigoureuse et en constante évolution. À travers ses analyses détaillées, il apporte un regard éclairé sur la dynamique des prix, aidant les investisseurs et passionnés à mieux comprendre et anticiper les mouvements du marché.
The contents and products mentioned on this page are in no way approved by Cointribune and should not be interpreted as falling under its responsibility.
Cointribune strives to communicate all useful information to readers, but cannot guarantee its accuracy and completeness. We invite readers to do their research before taking any action related to the company and to take full responsibility for their decisions. This article should not be considered as investment advice, an offer, or an invitation to purchase any products or services.
Investment in digital financial assets carries risks.
Read more